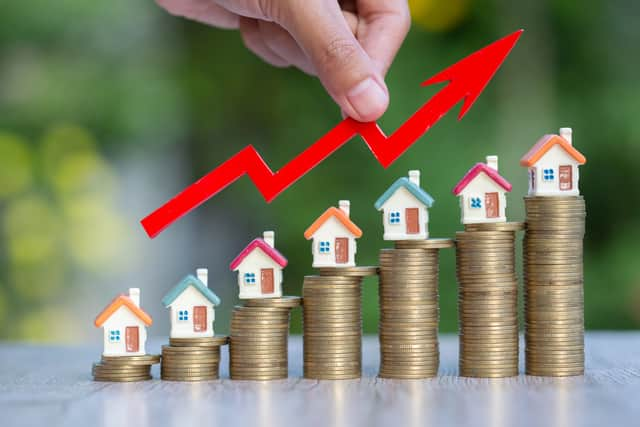
London house prices 2022: how much have sale prices gone up according to Land Registry - will they go down?
and live on Freeview channel 276
Since the Coronavirus pandemic, house prices have risen to record breaking highs, but there are now growing concerns that the UK is heading straight towards a housing market crash.
This is reportedly the hardest time ever for first time buyers to get their foot well and firmly on the property ladder, with popular online housing website Rightmove saying that the market will see “falls during the second half of the year.”
Advertisement
Hide AdAdvertisement
Hide AdThe market crash could coincide with the very real possibility of another UK recession with the cost of living crisis.
The last time the UK faced a recession was in 2008, which also saw a market crash, with houses dropping in price by an average of 15%.


What is the average price of a property in England?
As of April 2022, the average house price in England was £299,249, with the average price of a house being £368,614.
In London, average house prices increased by 7.9% in the year to April 2022, up from 4.9% in March 2022.
Advertisement
Hide AdAdvertisement
Hide AdThe National Association of Property Buyers (NAPB) says that in London, the most expensive region, the average property is now worth £534,977 - which is 9.7 times more than wages in the city.
What is the average price for a house in each London borough and what is the difference since 2021?
Barking and Dagenham - April 2022: £336,126 - April 2021: £310,454 - Difference: 8.3%
Barnet - April 2022: £596,898 - April 2021: £534,687 - Difference: 11.6%
Bexley - April 2022: £392,155 - April 2021: £358,992 - Difference: 9.2%
Advertisement
Hide AdAdvertisement
Hide AdBrent - April 2022: £546,934 - April 2021: £493,682 - Difference: 10.8%
Bromley - April 2022: £494,550 - April 2021: £455,807 - Difference: 8.7%
Camden - £874,081 - April 2021: £810,042 - Difference: 7.9%
Croydon - April 2022: £417,947 - April 2021: £393,783 - Difference: 6.1%
Ealing - April 2022: £525,438 - April 2021: £498,632 - Difference: 5.4%
Advertisement
Hide AdAdvertisement
Hide AdEnfield - April 2022: £449,967 - April 2021: £420,527 - Difference: 7%
Greenwich - April 2022: £434,433 - April 2021: £404,572 - Difference: 7.4%
Hackney - April 2022: £607,030 - April 2021: £577,155 - Difference: 5.2%
Hammersmith and Fulham - April 2022: £712,185 - April 2021: £739,881 - Difference: -2.5%
Advertisement
Hide AdAdvertisement
Hide AdHaringey - April 2022: £601,439 - April 2021: £557,785 - Difference: 7.8%
Harrow - April 2022: £487,236 - April 2021: £489,447 - Difference: 1.6%
Havering - April 2022: £425,898 - April 2021: £385,228 - Difference: 10.6%
Hillingdon - April 2022: £459,565 - April 2021: £426,391 - Difference: 7.8%
Advertisement
Hide AdAdvertisement
Hide AdHounslow - April 2022: £428,483 - April 2021: £430,286 - Difference: -0.4%
Islington - April 2022: £712,968 - April 2021: £667,755 - Difference: 6.8%
Kensington and Chelsea - April 2022: £1,513,711 - April 2021: £1,194,465 - Difference: 26.7%
Kingston upon Thames - April 2022: £528,433 - April 2021: £503,144 - Difference: 5%
Advertisement
Hide AdAdvertisement
Hide AdLambeth - April 2022: £545,756 - April 2021: £530,554 - Difference: 2.9%
Lewisham - April 2022: £446,546 - April 2021: £444,486 - Difference: 0.5%
Merton - April 2022: £566,919 - April 2021: £536,378 - Difference: 5.7%
Newham - April 2022: £407,474 - April 2021: £390,513 - Difference: 4.3%
Advertisement
Hide AdAdvertisement
Hide AdRedbridge - April 2022: £480,318 - April 2021: £446,034 - Difference: 7.7%
Richmond upon Thames - April 2022: £792,538 - April 2021: £682,862 - Difference: 16.1%
Southwark - April 2022: £527,636 - April 2021: £514,324 - Difference: 2.6%
Sutton - April 2022: £424,726 - April 2021: £394,600 - Difference: 7.6%
Advertisement
Hide AdAdvertisement
Hide AdTower Hamlets - April 2022: £499,716 - April 2021: £469,685 - Difference: 6.4%
Waltham Forest - April 2022: £478,261 - April 2021: £479,686 - Difference: -0.3%
Wandsworth - April 2022: £641,132 - April 2021: £591,272 - 8.4%
Westminster - April 2022: £977,554 - April 2021: £931,124 - Difference: 5%
When might the price of houses fall?
Advertisement
Hide AdAdvertisement
Hide AdCurrently, there is still a demand for houses, which keeps the prices at record highs.
However, high inflation will cause interest rates to rise too, which is predicted to slow the housing market down, which may cause prices to fall.
The cost of living crisis could have an impact on the market, too. Factors such as record petrol and energy prices, rising inflation and tax rises means people will have less income to spend on buying houses.
This may cause the demand to drop, with people offering smaller deposits causing the rate of house price growth to fall.
Advertisement
Hide AdAdvertisement
Hide AdAs per The Times, Capital Economics has forecast house prices to rise throughout 2022, before falling by 5% in 2023.
Where is the most expensive and cheapest place to live in England?
In April 2022, the most expensive area to purchase a property was Kensington and Chelsea, where the average cost was £1.5 million.
The cheapest area to purchase a property was Burnley, where the average cost was £119,000.
What is the average price of a certain type of property in England?
- Detached - April 2022: £471,335 - April 2021: £412,898 - Difference: 14.2%
- Semi-detached - April 2022: £286,099 - April 2021: £252,705 - Difference: 13.2%
- Terraced - April 2022: £243,702 - April 2021: £218,787 - Difference: 11.4%
- Flat/Maisonette - April 2022: £247,652 - April 2021: £231,535 - Difference: 7%
Comment Guidelines
National World encourages reader discussion on our stories. User feedback, insights and back-and-forth exchanges add a rich layer of context to reporting. Please review our Community Guidelines before commenting.
