
Westminster has been named the UK’s noisiest area - and this is why
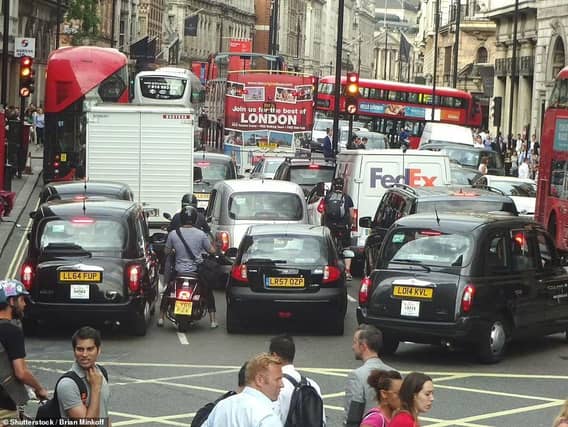

Ever had trouble sleeping because of noisy neighbours, traffic, or late-night music? You’re not alone. A new study reveals which UK areas are feeling the noise the most, and Westminster emerges as the loudest of them all.
The study, carried out by The Soundproof Windows, brought together a mix of public datasets and internal research to build an overall noise score for each city. The analysis considered factors linked to everyday urban noise, including complaints, nightlife, industry, population density and general city activity, with each element contributing differently to the final rankings.
Westminster comes out on top as the loudest city in the UK, with a total score of 56.65. That’s largely because it has a very high rate of noise complaints (68.10 per 1,000 people) and extremely dense living (11,533 people per km²). Its nightclub density is lower at 3.63 per 10,000 residents, but the area’s industrial density (145.8 per km²) and constant activity mean Westminster remains the noisiest spot in the country.
Smaller cities can be surprisingly noisy. Wells, in second place (48.79), is buzzing thanks to its high industrial density (246.9 per km²) and one of the busiest rates of construction in the country (224.32 permits per 10,000 residents). Noise complaints are low, but all that building and industrial activity keeps things loud. Chichester comes third (35.71) with a mix of industrial activity (87.2 per km²), ongoing construction (192.01 permits per 10,000 residents), some nightlife (5.36 nightclubs per 10,000 residents) and a population of 2,391.75 per km².
In the middle of the pack, it’s a mix of commuting, nightlife, and people density that makes cities noisy. Durham (34.09) gets a lot of its noise from long commute times and heavy construction (251.44 permits per 10,000 residents). Lichfield (29.85) combines a bit of nightlife (5.47 nightclubs per 10,000 residents) with population (2,345.01 per km²) and construction (94.29 permits per 10,000 residents). Southampton (28.36) is packed with people (19,396.89 per km²) and a fair bit of industrial activity (22.5 per km²), which keeps the noise levels up.
The last stretch of the top ten sees cities where traffic and city life do the talking. Newcastle upon Tyne (28.20) is noisy from its nightlife (6.60 nightclubs per 10,000 residents) and crowded streets (7,317.91 per km²). Hereford (28.08) feels the sound of long commutes (9.8 traffic index) and local industry (64.8 per km²). Kingston upon Hull (27.86) combines a fair share of complaints (13.50 per 1,000 residents) with nightlife (5.10 nightclubs per 10,000 residents), while Manchester (27.84) is packed with people (24,313.99 per km²), which keeps traffic and city noise constant.
Full list of the noisiest areas in the UK:
| Rank | Area | Noise Complaints (Rate per 1,000 Population) | Nightclubs (Rate per 10,000 Population) | Population Density (per km²) | Commute Time (Minutes) | Industriy Density (per km²) | Construction Work | Final Score |
| 1 | Westminster | 68.10 | 3.63 | 11533.02 | 6.5 | 145.8 | 0.40 | 56.65 |
| 2 | Wells | 2.30 | 5.98 | 3482.81 | 7.9 | 246.9 | 224.32 | 48.79 |
| 3 | Chichester | 4.90 | 5.36 | 2391.75 | 7.7 | 87.2 | 192.01 | 35.71 |
| 4 | Durham | 5.90 | 4.75 | 270.54 | 8.8 | 12.6 | 251.44 | 34.09 |
| 5 | Lichfield | 5.70 | 5.47 | 2345.01 | 7.5 | 53.9 | 94.29 | 29.85 |
| 6 | Southampton | 10.20 | 3.17 | 19396.89 | 7.1 | 22.5 | 0.10 | 28.36 |
| 7 | Newcastle upon Tyne | 6.40 | 6.60 | 7317.91 | 6.7 | 8.2 | 9.95 | 28.20 |
| 8 | Hereford | 3.10 | 2.98 | 2976.11 | 9.8 | 64.8 | 72.83 | 28.08 |
| 9 | Kingston upon Hull | 13.50 | 5.10 | 4597.87 | 7.6 | 13.9 | 3.96 | 27.86 |
| 10 | Manchester | 5.90 | 3.14 | 24313.99 | 6.7 | 16.3 | 1.48 | 27.84 |
| 11 | Norwich | 1.30 | 5.96 | 4455.92 | 7.4 | 11.9 | 2.30 | 24.19 |
| 12 | Nottingham | 21.30 | 1.56 | 10981.56 | 7 | 13.1 | 1.34 | 22.28 |
| 13 | Doncaster | 7.60 | 3.93 | 278.42 | 8.2 | 2.8 | 49.32 | 21.83 |
| 14 | Brighton and Hove | 7.20 | 3.61 | 8525.89 | 6.9 | 18.4 | 2.12 | 20.89 |
| 15 | Belfast | 16.54 | 2.45 | 5669.41 | - | 8.1 | 8.44 | 18.12 |
| 16 | Bradford | 3.80 | 3.14 | 4798.45 | 7.3 | 31.3 | 9.38 | 17.87 |
| 17 | Swansea | 17.70 | 3.19 | 847.19 | - | 2.7 | 7.18 | 17.55 |
| 18 | Portsmouth | 9.30 | 2.73 | 5458.39 | 6.7 | 32.0 | 2.28 | 17.42 |
| 19 | Gloucester | 4.80 | 3.10 | 3375.93 | 7.5 | 16.0 | 19.73 | 17.40 |
| 20 | Plymouth | 5.50 | 3.34 | 2764.73 | 7.4 | 15.0 | 3.17 | 17.06 |
| 21 | Leicester | 6.60 | 2.28 | 7847.14 | 7.1 | 14.0 | 3.30 | 16.43 |
| 22 | Bath | 4.20 | 2.13 | 3143.10 | 7.9 | 40.0 | 13.17 | 16.37 |
| 23 | Cambridge | 4.20 | 3.16 | 3127.52 | 7.1 | 8.6 | 36.14 | 16.16 |
| 24 | Coventry | 3.80 | 2.56 | 4613.19 | 7.3 | 12.0 | 31.46 | 15.65 |
| 25 | Wakefield | 4.90 | 0.82 | 2723.38 | 7.7 | 56.9 | 77.24 | 15.31 |
| 26 | Leeds | 6.50 | 2.48 | 807.04 | 7.4 | 6.8 | 43.57 | 14.72 |
| 27 | London | 14.90 | 0.20 | 6260.01 | 7 | 39.5 | 20.49 | 14.61 |
| 28 | Derby | 3.30 | 2.22 | 2923.75 | 7.5 | 12.0 | 27.61 | 13.77 |
| 29 | Liverpool | 5.70 | 1.49 | 8309.45 | 6.9 | 15.8 | 1.72 | 13.28 |
| 30 | Chelmsford | 4.30 | 1.54 | 762.58 | 8.3 | 11.5 | 17.88 | 12.76 |
| 31 | Bristol | 1.30 | 2.11 | 6545.93 | 6.9 | 19.6 | 9.58 | 12.70 |
| 32 | Milton Keynes | 6.00 | 1.48 | 2583.61 | 7.3 | 16.2 | 42.18 | 12.69 |
| 33 | Canterbury | 2.40 | 0.32 | 1937.08 | 7.4 | 36.5 | 137.66 | 12.39 |
| 34 | Birmingham | 4.50 | 0.85 | 10099.40 | 7.1 | 14.1 | 1.77 | 12.35 |
| 35 | Southend-on-Sea | 4.10 | 1.22 | 7071.60 | 7 | 27.8 | 8.47 | 12.25 |
| 36 | Oxford | 3.60 | 1.81 | 3123.93 | 7.2 | 7.2 | 42.13 | 12.12 |
| 37 | Newport | 4.37 | 3.03 | 1791.59 | - | 3.0 | 11.08 | 11.84 |
| 38 | Colchester | 3.30 | 0.42 | 3866.09 | 8 | 41.7 | 19.69 | 11.74 |
| 39 | Exeter | 4.30 | 1.30 | 2284.29 | 7.4 | 13.5 | 46.54 | 11.49 |
| 40 | Sunderland | 3.30 | 1.64 | 2539.36 | 7.6 | 6.5 | 20.05 | 11.39 |
| 41 | Lincoln | 11.10 | 0.77 | 2578.03 | 7.2 | 12.6 | 11.96 | 11.03 |
| 42 | Sheffield | 3.60 | 1.75 | 2056.81 | 7.5 | 5.7 | 3.70 | 10.56 |
| 43 | Chester | 4.10 | 0.54 | 167.32 | 8 | 3.1 | 71.03 | 9.87 |
| 44 | York | 12.50 | 0.49 | 581.72 | 7.5 | 3.4 | 10.12 | 9.83 |
| 45 | Edinburgh | 9.80 | 1.16 | 1982.01 | - | 6.3 | 36.12 | 9.76 |
| 46 | Cardiff | 8.30 | 1.25 | 3538.41 | - | 9.6 | 8.28 | 9.42 |
| 47 | Winchester | 2.30 | 0.39 | 62.66 | 7.8 | 1.4 | 102.75 | 9.08 |
| 48 | Stoke on Trent | 5.90 | 0.62 | 2781.86 | 7.5 | 9.7 | 5.39 | 8.83 |
| 49 | Worcester | 4.30 | 1.16 | 3054.66 | 6.9 | 11.7 | 17.71 | 8.76 |
| 50 | Lancaster | 3.50 | 0.84 | 83.18 | 8 | 1.1 | 25.44 | 8.55 |
| 51 | Salford | 3.80 | 0.63 | 750.00 | 6.8 | 13.2 | 49.48 | 6.51 |
| 52 | Wolverhampton | 1.90 | 0.20 | 2887.24 | 7.6 | 16.0 | 4.49 | 6.43 |
| 53 | Peterborough | 1.60 | 0.27 | 399.53 | 7.7 | 2.8 | 46.65 | 6.15 |
| 54 | St Albans | 4.00 | 0.20 | 457.52 | 7.3 | 6.0 | 19.01 | 4.93 |