
London named among the 'least desirable places to live in the UK'
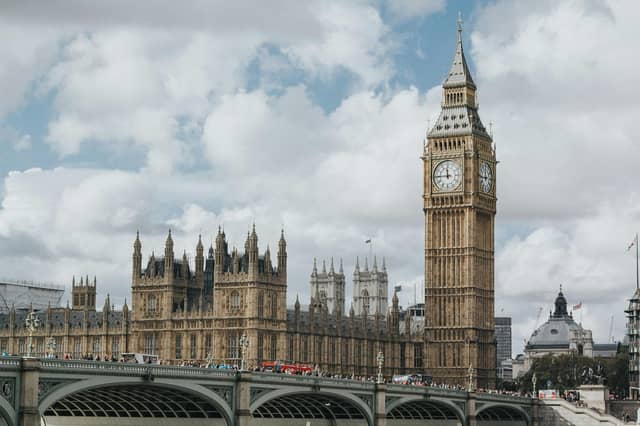

New data reveals Britain’s top destinations for the worst quality living.
The study, conducted by property information site Property Buyers Today , analysed five categories based on data from the Home Office and Tripadvisor. These include a culture score (based on shopping, nightlife, and more), a green score (based on the count and rating of nature and parks), a housing score (based on housing affordability), a utility score (based on energy and gas), and a violent crime score (based on the annual increase or decrease of reported incidents).
The five categories were given a score out of 100, which contributed to a final index score. The locations with the highest final index score have been named the most desirable places to live in Britain.
London's findings
London ranks 10th least desirable place to live, with a final index score of 39.52 out of 100, placing it above several other major local authorities but still below the national average. Despite achieving a relatively strong culture score of 51.75, supported by world-class museums, theatres, and entertainment venues, the capital struggles in several other areas. Its green score of 32.83 reflects limited access to nature relative to its size and population, while a utilities score of 29.48, highlights higher-than-average costs for essentials. However, the city performs notably well in terms of safety, with a violent crime score of 65.63, ranking 8th nationally and making it one of the safer large urban areas in the study. Moreover, London ranks last in the nation for housing, declaring it the most expensive city to live in the country, followed by Oxford.
Britain’s least desirable places to live in 2026
| Rank | Local authority | Culture score (/100) | Green score (/100) | Housing score (/100) | Utilities score (/100) | Violent crime score (/100) | Final index score (/100) |
| 1 | Slough | 14.88 | 30.08 | 32.69 | 52.44 | 47.17 | 28.18 |
| 2 | Luton | 29.89 | 13.53 | 42.81 | 44.46 | 26.61 | 32.89 |
| 3 | Hove | 36.52 | 11.52 | 16.71 | 47.25 | 38.53 | 33.78 |
| 4 | Basildon | 23.54 | 37.71 | 39.27 | 49.65 | 63.67 | 34.82 |
| 5 | Gillingham | 26.68 | 24.15 | 47.60 | 47.25 | 57.90 | 35.59 |
| 6 | High Wycombe | 36.35 | 19.43 | 31.33 | 52.44 | 40.45 | 37.57 |
| 7 | Crawley | 34.19 | 38.53 | 38.93 | 55.03 | 13.35 | 37.75 |
| 8 | West Bromwich | 19.85 | 25.28 | 68.73 | 62.57 | 55.80 | 37.98 |
| 9 | Watford | 36.77 | 49.23 | 25.18 | 49.85 | 47.60 | 39.46 |
| 10 | London | 51.75 | 32.83 | 0.00 | 29.48 | 65.63 | 39.52 |
Saif Derzi, Founder of Property Buyers Today commented on the findings:
“Choosing where to live isn’t just about property prices, there are many factors that go into living in a desirable area. Luckily, this comprehensive study takes all of those elements into account to reveal the best and worst areas to live in the UK.
“This research shows that desirability varies significantly across the UK, with northern cities like York and Blackpool performing strongly due to their combination of a wide variety of cultural amenities and affordable housing.”