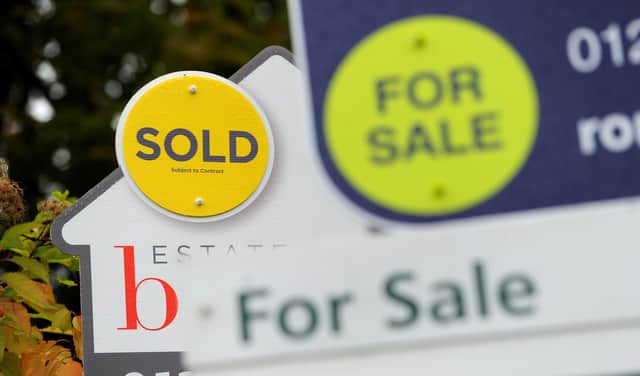
Lewisham house prices increased slightly in June


House prices increased slightly, by 0.3%, in Lewisham in June, new figures show.
The boost contributes to the longer-term trend, which has seen property prices in the area achieve 3.6% annual growth.
Advertisement
Hide AdAdvertisement
Hide AdThe average Lewisham house price in June was £438,598.6355, Land Registry figures show – a 0.3% increase on May.
Over the month, the picture was less good than that across London, where prices increased 2.5322733%, and Lewisham underperformed compared to the 4.4989563% rise for the UK as a whole.
Over the last year, the average sale price of property in Lewisham rose by £15,000 – putting the area 23rd among London’s 33 local authorities for annual growth.
The best annual growth in the region was in Harrow, where property prices increased on average by 16.7%, to £522,000. At the other end of the scale, properties in City of London lost 13.2% of their value, giving an average price of £756,000.
Winners and Losers
Advertisement
Hide AdAdvertisement
Hide AdOwners of terraced houses saw the biggest improvement in property prices in Lewisham in June – they increased 0.6%, to £531,562.3465 on average. Over the last year, prices rose by 5.8%.
Among other types of property:
Detached: down 0.1% monthly; up 4.8% annually; £890,239.9016 averageSemi-detached: up 0.2% monthly; up 4.8% annually; £721,614.635 averageFlats: up 0.2% monthly; up 2.2% annually; £358,130.9017 average
First steps on the property ladder
First-time buyers in Lewisham spent an average of £381,000 on their property – £12,000 more than a year ago, and £26,000 more than in June 2016.
By comparison, former owner-occupiers paid £528,000 on average in June – 38.7% more than first-time buyers.
How do property prices in Lewisham compare?
Advertisement
Hide AdAdvertisement
Hide AdBuyers paid 14.1% less than the average price in London (£510,000) in June for a property in Lewisham. Across London, property prices are high compared to those across the UK, where the average cost £266,000.
The most expensive properties in London were in Kensington and Chelsea – £1.2 million on average, and 2.8 times as much as in Lewisham. Kensington and Chelsea properties cost 3.9 times as much as homes in Barking and Dagenham (£319,000 average), at the other end of the scale.
The highest property prices across the UK were in Kensington and Chelsea, where the average June sale price of £1.2 million could buy 13 properties in Burnley (average £99,000).
Factfile
Average property price in June
Lewisham: £438,598.6355London:£510,298.6011UK: £265,668.1787
Annual growth to June
Lewisham: +3.6%London: +6.3%UK: +13.2%
Best and worst annual growth in London
Harrow: +16.7%City of London: -13.2%